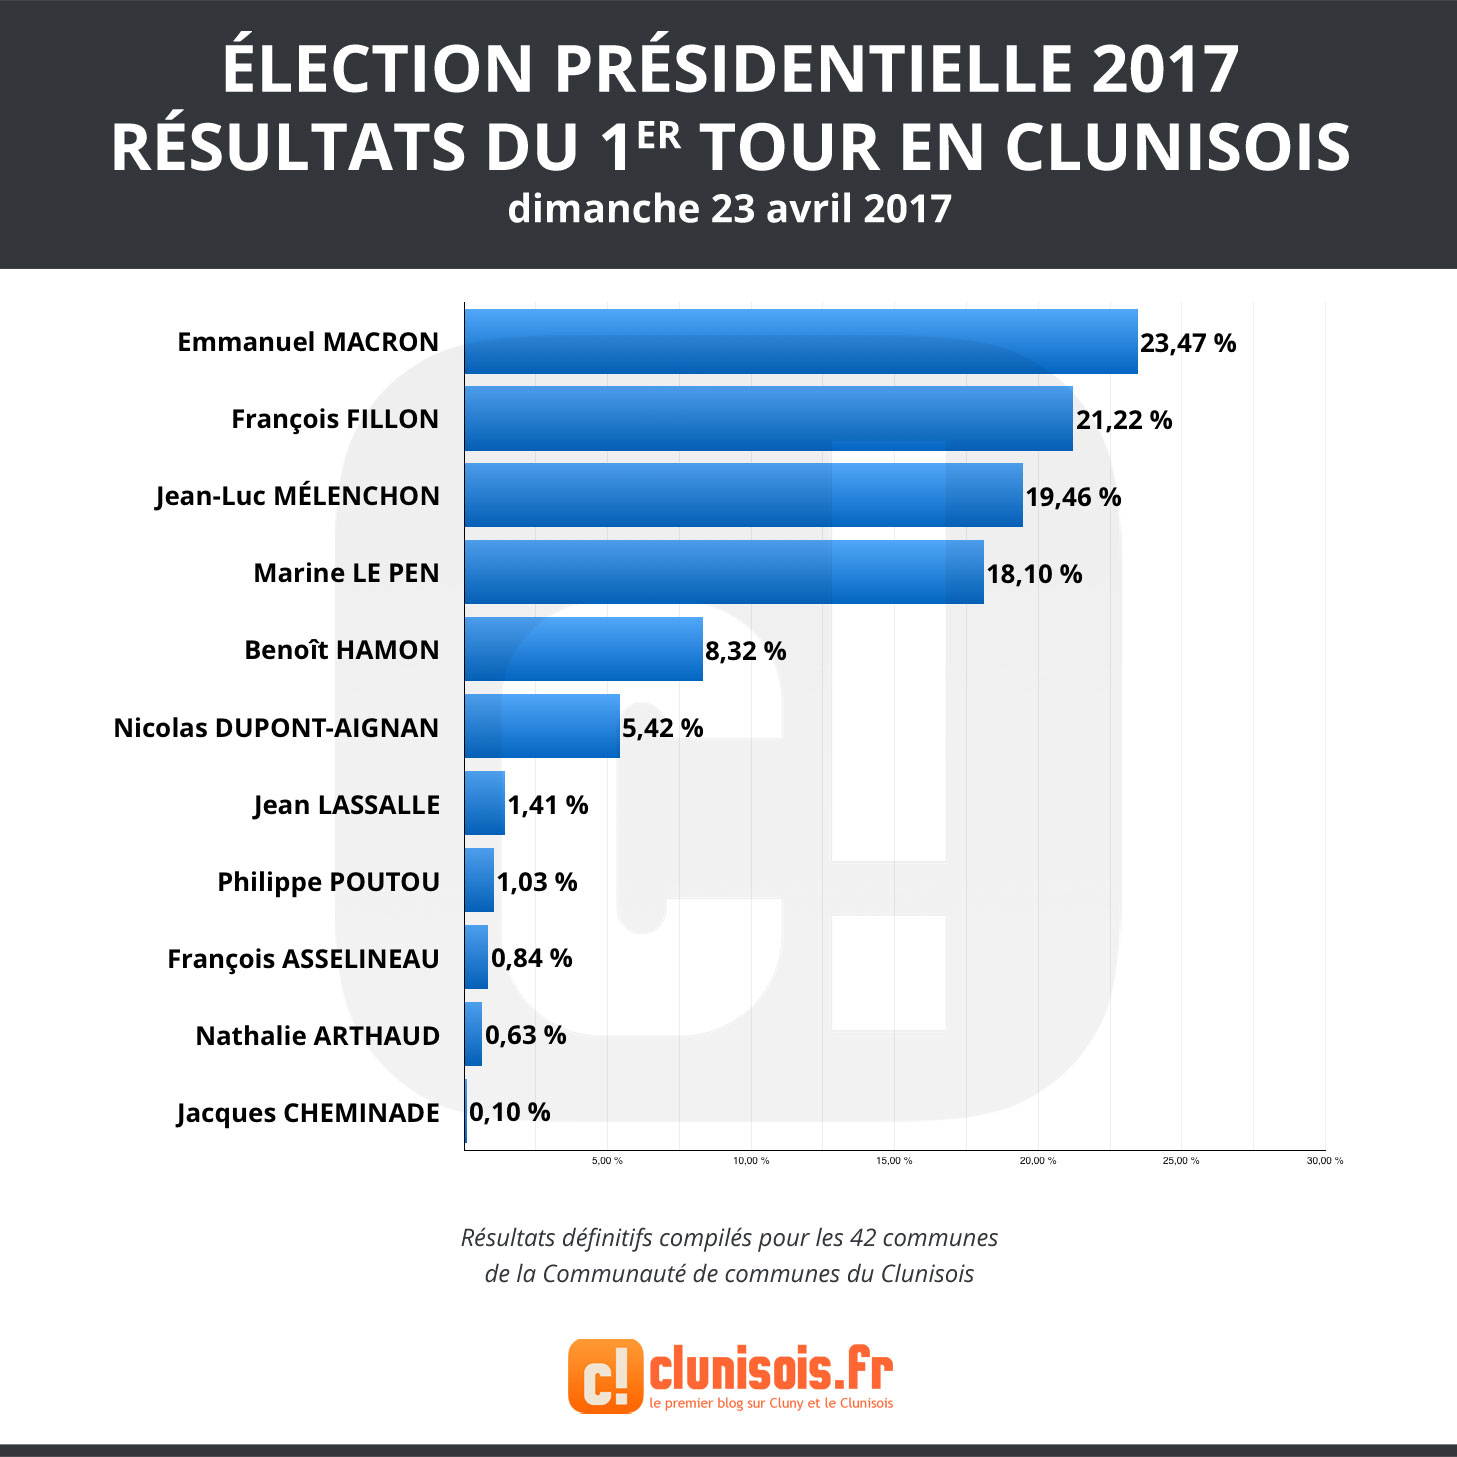
Pour qui votre commune a-t-elle voté au 1er tour de l’élection présidentielle 2017 ? Découvrez tous les résultats pour chacune des 42 communes du Clunisois.
Sur le total des 42 communes du Clunisois, c’est Emmanuel Macron qui arrive en tête (23 %), devant François Fillon (21 %). En 3e place, on retrouve Jean-Luc Mélenchon (19 %), puis Marine Le Pen en 4e place (18 %) et Benoît Hamon (8 %) en 5e position.
La participation en Clunisois s’établit à 81,80 %, soit 8 322 votants sur 10 173 inscrits. On totalise 242 bulletins blancs et nuls, soit 8 080 suffrages exprimés dans la communauté de communes du Clunisois.
Découvrez le détail pour chaque commune ci-dessous.
Ameugny

| Liste des candidats | Voix | % Inscrits | % Exprimés |
|---|---|---|---|
| M. Emmanuel MACRON | 31 | 30,10 | 35,63 |
| M. François FILLON | 18 | 17,48 | 20,69 |
| Mme Marine LE PEN | 11 | 10,68 | 12,64 |
| M. Jean-Luc MÉLENCHON | 9 | 8,74 | 10,34 |
| M. Nicolas DUPONT-AIGNAN | 8 | 7,77 | 9,20 |
| M. Benoît HAMON | 8 | 7,77 | 9,20 |
| M. Philippe POUTOU | 1 | 0,97 | 1,15 |
| M. Jean LASSALLE | 1 | 0,97 | 1,15 |
| Mme Nathalie ARTHAUD | 0 | 0,00 | 0,00 |
| M. Jacques CHEMINADE | 0 | 0,00 | 0,00 |
| M. François ASSELINEAU | 0 | 0,00 | 0,00 |
- Inscrits : 103
- Votants : 92 (soit 89,32 % de participation)
- Exprimés : 87
- Blancs et nuls : 5.
Bergesserin
| Liste des candidats | Voix | % Inscrits | % Exprimés |
|---|---|---|---|
| Mme Marine LE PEN | 30 | 20,41 | 24,79 |
| M. Emmanuel MACRON | 27 | 18,37 | 22,31 |
| M. François FILLON | 20 | 13,61 | 16,53 |
| M. Jean-Luc MÉLENCHON | 18 | 12,24 | 14,88 |
| M. Nicolas DUPONT-AIGNAN | 17 | 11,56 | 14,05 |
| M. Benoît HAMON | 6 | 4,08 | 4,96 |
| M. Philippe POUTOU | 2 | 1,36 | 1,65 |
| M. François ASSELINEAU | 1 | 0,68 | 0,83 |
| Mme Nathalie ARTHAUD | 0 | 0,00 | 0,00 |
| M. Jacques CHEMINADE | 0 | 0,00 | 0,00 |
| M. Jean LASSALLE | 0 | 0,00 | 0,00 |
- Inscrits : 147
- Votants : 128 (soit 87,07 % de participation)
- Exprimés : 121
- Blancs et nuls : 7.
Berzé-le-Châtel
| Liste des candidats | Voix | % Inscrits | % Exprimés |
|---|---|---|---|
| M. François FILLON | 14 | 25,45 | 26,92 |
| Mme Marine LE PEN | 13 | 23,64 | 25,00 |
| M. Jean-Luc MÉLENCHON | 12 | 21,82 | 23,08 |
| M. Nicolas DUPONT-AIGNAN | 5 | 9,09 | 9,62 |
| M. Jean LASSALLE | 3 | 5,45 | 5,77 |
| M. Emmanuel MACRON | 2 | 3,64 | 3,85 |
| M. Benoît HAMON | 2 | 3,64 | 3,85 |
| M. Jacques CHEMINADE | 1 | 1,82 | 1,92 |
| Mme Nathalie ARTHAUD | 0 | 0,00 | 0,00 |
| M. Philippe POUTOU | 0 | 0,00 | 0,00 |
| M. François ASSELINEAU | 0 | 0,00 | 0,00 |
- Inscrits : 55
- Votants : 53 (soit 96,36 % de participation)
- Exprimés : 52
- Blancs et nuls : 1.
Blanot
| Liste des candidats | Voix | % Inscrits | % Exprimés |
|---|---|---|---|
| M. Jean-Luc MÉLENCHON | 32 | 21,62 | 27,83 |
| M. François FILLON | 22 | 14,86 | 19,13 |
| Mme Marine LE PEN | 18 | 12,16 | 15,65 |
| M. Emmanuel MACRON | 16 | 10,81 | 13,91 |
| M. Benoît HAMON | 12 | 8,11 | 10,43 |
| M. Nicolas DUPONT-AIGNAN | 7 | 4,73 | 6,09 |
| M. Jean LASSALLE | 4 | 2,70 | 3,48 |
| M. Philippe POUTOU | 3 | 2,03 | 2,61 |
| M. François ASSELINEAU | 1 | 0,68 | 0,87 |
| Mme Nathalie ARTHAUD | 0 | 0,00 | 0,00 |
| M. Jacques CHEMINADE | 0 | 0,00 | 0,00 |
- Inscrits : 148
- Votants : 118 (soit 79,73 % de participation)
- Exprimés : 115
- Blancs et nuls : 1.
Bonnay
| Liste des candidats | Voix | % Inscrits | % Exprimés |
|---|---|---|---|
| M. Jean-Luc MÉLENCHON | 47 | 20,80 | 26,70 |
| M. Emmanuel MACRON | 37 | 16,37 | 21,02 |
| M. François FILLON | 29 | 12,83 | 16,48 |
| Mme Marine LE PEN | 27 | 11,95 | 15,34 |
| M. Nicolas DUPONT-AIGNAN | 13 | 5,75 | 7,39 |
| M. Benoît HAMON | 12 | 5,31 | 6,82 |
| M. Philippe POUTOU | 4 | 1,77 | 2,27 |
| M. Jean LASSALLE | 4 | 1,77 | 2,27 |
| Mme Nathalie ARTHAUD | 1 | 0,44 | 0,57 |
| M. Jacques CHEMINADE | 1 | 0,44 | 0,57 |
| M. François ASSELINEAU | 1 | 0,44 | 0,57 |
- Inscrits : 226
- Votants : 179 (soit 79,20 % de participation)
- Exprimés : 176
- Blancs et nuls : 3.
Bray

| Liste des candidats | Voix | % Inscrits | % Exprimés |
|---|---|---|---|
| M. Jean-Luc MÉLENCHON | 32 | 27,83 | 30,77 |
| Mme Marine LE PEN | 25 | 21,74 | 24,04 |
| M. François FILLON | 25 | 21,74 | 24,04 |
| M. Emmanuel MACRON | 13 | 11,30 | 12,50 |
| M. Benoît HAMON | 5 | 4,35 | 4,81 |
| M. Nicolas DUPONT-AIGNAN | 3 | 2,61 | 2,88 |
| M. Jean LASSALLE | 1 | 0,87 | 0,96 |
| Mme Nathalie ARTHAUD | 0 | 0,00 | 0,00 |
| M. Philippe POUTOU | 0 | 0,00 | 0,00 |
| M. Jacques CHEMINADE | 0 | 0,00 | 0,00 |
| M. François ASSELINEAU | 0 | 0,00 | 0,00 |
- Inscrits : 115
- Votants : 106 (soit 92,17 % de participation)
- Exprimés : 104
- Blancs et nuls : 2.
Buffières
| Liste des candidats | Voix | % Inscrits | % Exprimés |
|---|---|---|---|
| M. François FILLON | 37 | 16,02 | 22,42 |
| M. Emmanuel MACRON | 36 | 15,58 | 21,82 |
| Mme Marine LE PEN | 32 | 13,85 | 19,39 |
| M. Jean-Luc MÉLENCHON | 27 | 11,69 | 16,36 |
| M. Benoît HAMON | 14 | 6,06 | 8,48 |
| M. Nicolas DUPONT-AIGNAN | 6 | 2,60 | 3,64 |
| M. Philippe POUTOU | 6 | 2,60 | 3,64 |
| Mme Nathalie ARTHAUD | 3 | 1,30 | 1,82 |
| M. Jean LASSALLE | 2 | 0,87 | 1,21 |
| M. François ASSELINEAU | 2 | 0,87 | 1,21 |
| M. Jacques CHEMINADE | 0 | 0,00 | 0,00 |
- Inscrits : 231
- Votants : 176 (soit 76,19 % de participation)
- Exprimés : 165
- Blancs et nuls : 11.
Burzy

| Liste des candidats | Voix | % Inscrits | % Exprimés |
|---|---|---|---|
| M. François FILLON | 17 | 27,87 | 36,96 |
| M. Benoît HAMON | 9 | 14,75 | 19,57 |
| Mme Marine LE PEN | 7 | 11,48 | 15,22 |
| M. Emmanuel MACRON | 6 | 9,84 | 13,04 |
| M. Jean-Luc MÉLENCHON | 5 | 8,20 | 10,87 |
| Mme Nathalie ARTHAUD | 1 | 1,64 | 2,17 |
| M. Jean LASSALLE | 1 | 1,64 | 2,17 |
| M. Nicolas DUPONT-AIGNAN | 0 | 0,00 | 0,00 |
| M. Philippe POUTOU | 0 | 0,00 | 0,00 |
| M. Jacques CHEMINADE | 0 | 0,00 | 0,00 |
| M. François ASSELINEAU | 0 | 0,00 | 0,00 |
- Inscrits : 61
- Votants : 46 (soit 75,41 % de participation)
- Exprimés : 46
- Blancs et nuls : 0.
Château
| Liste des candidats | Voix | % Inscrits | % Exprimés |
|---|---|---|---|
| M. Emmanuel MACRON | 59 | 28,37 | 34,71 |
| M. François FILLON | 33 | 15,87 | 19,41 |
| M. Jean-Luc MÉLENCHON | 28 | 13,46 | 16,47 |
| Mme Marine LE PEN | 20 | 9,62 | 11,76 |
| M. Benoît HAMON | 15 | 7,21 | 8,82 |
| M. Nicolas DUPONT-AIGNAN | 9 | 4,33 | 5,29 |
| M. Jean LASSALLE | 3 | 1,44 | 1,76 |
| M. Philippe POUTOU | 2 | 0,96 | 1,18 |
| M. François ASSELINEAU | 1 | 0,48 | 0,59 |
| Mme Nathalie ARTHAUD | 0 | 0,00 | 0,00 |
| M. Jacques CHEMINADE | 0 | 0,00 | 0,00 |
- Inscrits : 208
- Votants : 174 (soit 83,65 % de participation)
- Exprimés : 170
- Blancs et nuls : 4.
Chérizet

| Liste des candidats | Voix | % Inscrits | % Exprimés |
|---|---|---|---|
| M. François FILLON | 12 | 40,00 | 63,16 |
| M. Emmanuel MACRON | 3 | 10,00 | 15,79 |
| Mme Marine LE PEN | 2 | 6,67 | 10,53 |
| M. François ASSELINEAU | 2 | 6,67 | 10,53 |
| M. Nicolas DUPONT-AIGNAN | 0 | 0,00 | 0,00 |
| M. Benoît HAMON | 0 | 0,00 | 0,00 |
| Mme Nathalie ARTHAUD | 0 | 0,00 | 0,00 |
| M. Philippe POUTOU | 0 | 0,00 | 0,00 |
| M. Jacques CHEMINADE | 0 | 0,00 | 0,00 |
| M. Jean LASSALLE | 0 | 0,00 | 0,00 |
| M. Jean-Luc MÉLENCHON | 0 | 0,00 | 0,00 |
- Inscrits : 30
- Votants : 21 (soit 70,00 % de participation)
- Exprimés : 19
- Blancs et nuls : 2.
Chevagny-sur-Guye

| Liste des candidats | Voix | % Inscrits | % Exprimés |
|---|---|---|---|
| M. Emmanuel MACRON | 14 | 20,29 | 25,93 |
| M. François FILLON | 14 | 20,29 | 25,93 |
| M. Benoît HAMON | 12 | 17,39 | 22,22 |
| M. Jean-Luc MÉLENCHON | 8 | 11,59 | 14,81 |
| M. Nicolas DUPONT-AIGNAN | 3 | 4,35 | 5,56 |
| Mme Marine LE PEN | 1 | 1,45 | 1,85 |
| M. Philippe POUTOU | 1 | 1,45 | 1,85 |
| M. Jean LASSALLE | 1 | 1,45 | 1,85 |
| Mme Nathalie ARTHAUD | 0 | 0,00 | 0,00 |
| M. Jacques CHEMINADE | 0 | 0,00 | 0,00 |
| M. François ASSELINEAU | 0 | 0,00 | 0,00 |
- Inscrits : 69
- Votants : 54 (soit 78,26 % de participation)
- Exprimés : 54
- Blancs et nuls : 0.
Chiddes
| Liste des candidats | Voix | % Inscrits | % Exprimés |
|---|---|---|---|
| M. Emmanuel MACRON | 19 | 23,75 | 29,23 |
| M. François FILLON | 16 | 20,00 | 24,62 |
| Mme Marine LE PEN | 13 | 16,25 | 20,00 |
| M. Benoît HAMON | 6 | 7,50 | 9,23 |
| M. Jean-Luc MÉLENCHON | 6 | 7,50 | 9,23 |
| M. Nicolas DUPONT-AIGNAN | 4 | 5,00 | 6,15 |
| M. Jean LASSALLE | 1 | 1,25 | 1,54 |
| Mme Nathalie ARTHAUD | 0 | 0,00 | 0,00 |
| M. Philippe POUTOU | 0 | 0,00 | 0,00 |
| M. Jacques CHEMINADE | 0 | 0,00 | 0,00 |
| M. François ASSELINEAU | 0 | 0,00 | 0,00 |
- Inscrits : 80
- Votants : 67 (soit 83,75 % de participation)
- Exprimés : 65
- Blancs et nuls : 2.
Chissey-lès-Mâcon
| Liste des candidats | Voix | % Inscrits | % Exprimés |
|---|---|---|---|
| M. Jean-Luc MÉLENCHON | 51 | 22,27 | 28,98 |
| M. Emmanuel MACRON | 43 | 18,78 | 24,43 |
| M. François FILLON | 33 | 14,41 | 18,75 |
| Mme Marine LE PEN | 22 | 9,61 | 12,50 |
| M. Benoît HAMON | 12 | 5,24 | 6,82 |
| M. François ASSELINEAU | 6 | 2,62 | 3,41 |
| M. Nicolas DUPONT-AIGNAN | 5 | 2,18 | 2,84 |
| M. Philippe POUTOU | 2 | 0,87 | 1,14 |
| M. Jean LASSALLE | 2 | 0,87 | 1,14 |
| Mme Nathalie ARTHAUD | 0 | 0,00 | 0,00 |
| M. Jacques CHEMINADE | 0 | 0,00 | 0,00 |
- Inscrits : 229
- Votants : 183 (soit 79,91 % de participation)
- Exprimés : 176
- Blancs et nuls : 7.
Cluny
| Liste des candidats | Voix | % Inscrits | % Exprimés |
|---|---|---|---|
| M. Emmanuel MACRON | 576 | 18,76 | 23,92 |
| M. François FILLON | 539 | 17,55 | 22,38 |
| M. Jean-Luc MÉLENCHON | 510 | 16,61 | 21,18 |
| Mme Marine LE PEN | 368 | 11,98 | 15,28 |
| M. Benoît HAMON | 218 | 7,10 | 9,05 |
| M. Nicolas DUPONT-AIGNAN | 121 | 3,94 | 5,02 |
| M. Philippe POUTOU | 26 | 0,85 | 1,08 |
| M. Jean LASSALLE | 21 | 0,68 | 0,87 |
| M. François ASSELINEAU | 15 | 0,49 | 0,62 |
| Mme Nathalie ARTHAUD | 13 | 0,42 | 0,54 |
| M. Jacques CHEMINADE | 1 | 0,03 | 0,04 |
- Inscrits : 3071
- Votants : 2467 (soit 80,33 % de participation)
- Exprimés : 2408
- Blancs et nuls : 59.
Cortambert
| Liste des candidats | Voix | % Inscrits | % Exprimés |
|---|---|---|---|
| M. Emmanuel MACRON | 40 | 20,30 | 25,64 |
| M. François FILLON | 40 | 20,30 | 25,64 |
| M. Jean-Luc MÉLENCHON | 29 | 14,72 | 18,59 |
| Mme Marine LE PEN | 21 | 10,66 | 13,46 |
| M. Nicolas DUPONT-AIGNAN | 10 | 5,08 | 6,41 |
| M. Benoît HAMON | 10 | 5,08 | 6,41 |
| M. Philippe POUTOU | 3 | 1,52 | 1,92 |
| M. Jean LASSALLE | 3 | 1,52 | 1,92 |
| Mme Nathalie ARTHAUD | 0 | 0,00 | 0,00 |
| M. Jacques CHEMINADE | 0 | 0,00 | 0,00 |
| M. François ASSELINEAU | 0 | 0,00 | 0,00 |
- Inscrits : 196
- Votants : 164 (soit 83,25 % de participation)
- Exprimés : 156
- Blancs et nuls : 8.
Cortevaix
| Liste des candidats | Voix | % Inscrits | % Exprimés |
|---|---|---|---|
| M. Emmanuel MACRON | 55 | 25,23 | 31,07 |
| Mme Marine LE PEN | 41 | 18,81 | 23,16 |
| M. François FILLON | 34 | 15,60 | 19,21 |
| M. Jean-Luc MÉLENCHON | 29 | 13,30 | 16,38 |
| M. Nicolas DUPONT-AIGNAN | 8 | 3,67 | 4,52 |
| M. Benoît HAMON | 4 | 1,83 | 2,26 |
| Mme Nathalie ARTHAUD | 2 | 0,92 | 1,13 |
| M. Jean LASSALLE | 2 | 0,92 | 1,13 |
| M. Philippe POUTOU | 1 | 0,46 | 0,56 |
| M. François ASSELINEAU | 1 | 0,46 | 0,56 |
| M. Jacques CHEMINADE | 0 | 0,00 | 0,00 |
- Inscrits : 218
- Votants : 190 (soit 87,16 % de participation)
- Exprimés : 177
- Blancs et nuls : 13.
Curtil-sous-Buffières

| Liste des candidats | Voix | % Inscrits | % Exprimés |
|---|---|---|---|
| Mme Marine LE PEN | 13 | 19,70 | 22,03 |
| M. Jean-Luc MÉLENCHON | 13 | 19,70 | 22,03 |
| M. François FILLON | 13 | 19,70 | 22,03 |
| M. Emmanuel MACRON | 7 | 10,61 | 11,86 |
| M. Jean LASSALLE | 4 | 6,06 | 6,78 |
| M. Nicolas DUPONT-AIGNAN | 3 | 4,55 | 5,08 |
| M. Benoît HAMON | 2 | 3,03 | 3,39 |
| Mme Nathalie ARTHAUD | 2 | 3,03 | 3,39 |
| M. Jacques CHEMINADE | 1 | 1,52 | 1,69 |
| M. François ASSELINEAU | 1 | 1,52 | 1,69 |
| M. Philippe POUTOU | 0 | 0,00 | 0,00 |
- Inscrits : 66
- Votants : 60 (soit 90,91 % de participation)
- Exprimés : 59
- Blancs et nuls : 1.
Donzy-le-Pertuis

| Liste des candidats | Voix | % Inscrits | % Exprimés |
|---|---|---|---|
| M. Emmanuel MACRON | 29 | 23,02 | 27,10 |
| M. Jean-Luc MÉLENCHON | 25 | 19,84 | 23,36 |
| Mme Marine LE PEN | 22 | 17,46 | 20,56 |
| M. François FILLON | 15 | 11,90 | 14,02 |
| M. Nicolas DUPONT-AIGNAN | 8 | 6,35 | 7,48 |
| M. Benoît HAMON | 5 | 3,97 | 4,67 |
| Mme Nathalie ARTHAUD | 1 | 0,79 | 0,93 |
| M. Jean LASSALLE | 1 | 0,79 | 0,93 |
| M. François ASSELINEAU | 1 | 0,79 | 0,93 |
| M. Philippe POUTOU | 0 | 0,00 | 0,00 |
| M. Jacques CHEMINADE | 0 | 0,00 | 0,00 |
- Inscrits : 126
- Votants : 108 (soit 85,71 % de participation)
- Exprimés : 107
- Blancs et nuls : 1.
Flagy

| Liste des candidats | Voix | % Inscrits | % Exprimés |
|---|---|---|---|
| M. Emmanuel MACRON | 34 | 21,38 | 26,36 |
| M. François FILLON | 28 | 17,61 | 21,71 |
| M. Jean-Luc MÉLENCHON | 21 | 13,21 | 16,28 |
| Mme Marine LE PEN | 16 | 10,06 | 12,40 |
| M. Benoît HAMON | 15 | 9,43 | 11,63 |
| M. Nicolas DUPONT-AIGNAN | 10 | 6,29 | 7,75 |
| M. Philippe POUTOU | 2 | 1,26 | 1,55 |
| M. Jean LASSALLE | 2 | 1,26 | 1,55 |
| Mme Nathalie ARTHAUD | 1 | 0,63 | 0,78 |
| M. Jacques CHEMINADE | 0 | 0,00 | 0,00 |
| M. François ASSELINEAU | 0 | 0,00 | 0,00 |
- Inscrits : 159
- Votants : 131 (soit 82,39 % de participation)
- Exprimés : 129
- Blancs et nuls : 2.
Jalogny

| Liste des candidats | Voix | % Inscrits | % Exprimés |
|---|---|---|---|
| M. Jean-Luc MÉLENCHON | 67 | 23,26 | 27,69 |
| M. Emmanuel MACRON | 51 | 17,71 | 21,07 |
| Mme Marine LE PEN | 42 | 14,58 | 17,36 |
| M. François FILLON | 41 | 14,24 | 16,94 |
| M. Benoît HAMON | 25 | 8,68 | 10,33 |
| M. Nicolas DUPONT-AIGNAN | 5 | 1,74 | 2,07 |
| M. Jean LASSALLE | 4 | 1,39 | 1,65 |
| Mme Nathalie ARTHAUD | 3 | 1,04 | 1,24 |
| M. Philippe POUTOU | 3 | 1,04 | 1,24 |
| M. François ASSELINEAU | 1 | 0,35 | 0,41 |
| M. Jacques CHEMINADE | 0 | 0,00 | 0,00 |
- Inscrits : 288
- Votants : 250 (soit 86,81 % de participation)
- Exprimés : 242
- Blancs et nuls : 8.
Joncy
| Liste des candidats | Voix | % Inscrits | % Exprimés |
|---|---|---|---|
| Mme Marine LE PEN | 63 | 18,26 | 23,16 |
| M. François FILLON | 60 | 17,39 | 22,06 |
| M. Jean-Luc MÉLENCHON | 50 | 14,49 | 18,38 |
| M. Emmanuel MACRON | 48 | 13,91 | 17,65 |
| M. Nicolas DUPONT-AIGNAN | 31 | 8,99 | 11,40 |
| M. Benoît HAMON | 9 | 2,61 | 3,31 |
| M. Philippe POUTOU | 4 | 1,16 | 1,47 |
| M. François ASSELINEAU | 3 | 0,87 | 1,10 |
| M. Jean LASSALLE | 2 | 0,58 | 0,74 |
| Mme Nathalie ARTHAUD | 1 | 0,29 | 0,37 |
| M. Jacques CHEMINADE | 1 | 0,29 | 0,37 |
- Inscrits : 345
- Votants : 285 (soit 82,61 % de participation)
- Exprimés : 272
- Blancs et nuls : 13.
La Guiche
| Liste des candidats | Voix | % Inscrits | % Exprimés |
|---|---|---|---|
| Mme Marine LE PEN | 93 | 20,26 | 28,18 |
| M. Emmanuel MACRON | 86 | 18,74 | 26,06 |
| M. François FILLON | 62 | 13,51 | 18,79 |
| M. Jean-Luc MÉLENCHON | 47 | 10,24 | 14,24 |
| M. Benoît HAMON | 27 | 5,88 | 8,18 |
| M. Nicolas DUPONT-AIGNAN | 5 | 1,09 | 1,52 |
| Mme Nathalie ARTHAUD | 5 | 1,09 | 1,52 |
| M. Jean LASSALLE | 2 | 0,44 | 0,61 |
| M. François ASSELINEAU | 2 | 0,44 | 0,61 |
| M. Jacques CHEMINADE | 1 | 0,22 | 0,30 |
| M. Philippe POUTOU | 0 | 0,00 | 0,00 |
- Inscrits : 459
- Votants : 337 (soit 73,42 % de participation)
- Exprimés : 330
- Blancs et nuls : 7.
La Vineuse-sur-Frégande
| Liste des candidats | Voix | % Inscrits | % Exprimés |
|---|---|---|---|
| M. Emmanuel MACRON | 95 | 18,85 | 24,42 |
| M. François FILLON | 86 | 17,06 | 22,11 |
| M. Jean-Luc MÉLENCHON | 71 | 14,09 | 18,25 |
| Mme Marine LE PEN | 70 | 13,89 | 17,99 |
| M. Benoît HAMON | 32 | 6,35 | 8,23 |
| M. Nicolas DUPONT-AIGNAN | 23 | 4,56 | 5,91 |
| M. Jean LASSALLE | 9 | 1,79 | 2,31 |
| Mme Nathalie ARTHAUD | 2 | 0,40 | 0,51 |
| M. Philippe POUTOU | 1 | 0,20 | 0,26 |
| M. Jacques CHEMINADE | 0 | 0,00 | 0,00 |
| M. François ASSELINEAU | 0 | 0,00 | 0,00 |
- Inscrits : 504
- Votants : 399 (soit 79,17 % de participation)
- Exprimés : 389
- Blancs et nuls : 10.
Lournand
| Liste des candidats | Voix | % Inscrits | % Exprimés |
|---|---|---|---|
| M. Jean-Luc MÉLENCHON | 55 | 21,48 | 27,09 |
| M. Emmanuel MACRON | 46 | 17,97 | 22,66 |
| M. François FILLON | 35 | 13,67 | 17,24 |
| Mme Marine LE PEN | 31 | 12,11 | 15,27 |
| M. Benoît HAMON | 19 | 7,42 | 9,36 |
| M. Nicolas DUPONT-AIGNAN | 9 | 3,52 | 4,43 |
| Mme Nathalie ARTHAUD | 4 | 1,56 | 1,97 |
| M. Jean LASSALLE | 2 | 0,78 | 0,99 |
| M. Philippe POUTOU | 1 | 0,39 | 0,49 |
| M. François ASSELINEAU | 1 | 0,39 | 0,49 |
| M. Jacques CHEMINADE | 0 | 0,00 | 0,00 |
- Inscrits : 256
- Votants : 211 (soit 82,42 % de participation)
- Exprimés : 203
- Blancs et nuls : 8.
Massilly

| Liste des candidats | Voix | % Inscrits | % Exprimés |
|---|---|---|---|
| Mme Marine LE PEN | 55 | 20,00 | 25,58 |
| M. Emmanuel MACRON | 52 | 18,91 | 24,19 |
| M. Jean-Luc MÉLENCHON | 46 | 16,73 | 21,40 |
| M. François FILLON | 23 | 8,36 | 10,70 |
| M. Benoît HAMON | 16 | 5,82 | 7,44 |
| M. Nicolas DUPONT-AIGNAN | 12 | 4,36 | 5,58 |
| M. Philippe POUTOU | 6 | 2,18 | 2,79 |
| M. Jean LASSALLE | 3 | 1,09 | 1,40 |
| M. François ASSELINEAU | 2 | 0,73 | 0,93 |
| Mme Nathalie ARTHAUD | 0 | 0,00 | 0,00 |
| M. Jacques CHEMINADE | 0 | 0,00 | 0,00 |
- Inscrits : 275
- Votants : 220 (soit 80,00 % de participation)
- Exprimés : 215
- Blancs et nuls : 5.
Mazille

| Liste des candidats | Voix | % Inscrits | % Exprimés |
|---|---|---|---|
| M. François FILLON | 73 | 25,89 | 32,30 |
| M. Emmanuel MACRON | 67 | 23,76 | 29,65 |
| Mme Marine LE PEN | 43 | 15,25 | 19,03 |
| M. Jean-Luc MÉLENCHON | 21 | 7,45 | 9,29 |
| M. Benoît HAMON | 10 | 3,55 | 4,42 |
| M. Nicolas DUPONT-AIGNAN | 9 | 3,19 | 3,98 |
| M. François ASSELINEAU | 3 | 1,06 | 1,33 |
| Mme Nathalie ARTHAUD | 0 | 0,00 | 0,00 |
| M. Philippe POUTOU | 0 | 0,00 | 0,00 |
| M. Jacques CHEMINADE | 0 | 0,00 | 0,00 |
| M. Jean LASSALLE | 0 | 0,00 | 0,00 |
- Inscrits : 282
- Votants : 230 (soit 81,56 % de participation)
- Exprimés : 226
- Blancs et nuls : 4.
Passy

| Liste des candidats | Voix | % Inscrits | % Exprimés |
|---|---|---|---|
| Mme Marine LE PEN | 16 | 29,63 | 38,10 |
| M. François FILLON | 12 | 22,22 | 28,57 |
| M. Emmanuel MACRON | 9 | 16,67 | 21,43 |
| M. Nicolas DUPONT-AIGNAN | 1 | 1,85 | 2,38 |
| M. Benoît HAMON | 1 | 1,85 | 2,38 |
| Mme Nathalie ARTHAUD | 1 | 1,85 | 2,38 |
| M. Jean LASSALLE | 1 | 1,85 | 2,38 |
| M. Jean-Luc MÉLENCHON | 1 | 1,85 | 2,38 |
| M. Philippe POUTOU | 0 | 0,00 | 0,00 |
| M. Jacques CHEMINADE | 0 | 0,00 | 0,00 |
| M. François ASSELINEAU | 0 | 0,00 | 0,00 |
- Inscrits : 54
- Votants : 44 (soit 81,48 % de participation)
- Exprimés : 42
- Blancs et nuls : 2.
Pressy-sous-Dondin
| Liste des candidats | Voix | % Inscrits | % Exprimés |
|---|---|---|---|
| M. François FILLON | 17 | 20,48 | 26,56 |
| M. Emmanuel MACRON | 16 | 19,28 | 25,00 |
| M. Jean-Luc MÉLENCHON | 9 | 10,84 | 14,06 |
| Mme Marine LE PEN | 6 | 7,23 | 9,38 |
| M. Jean LASSALLE | 5 | 6,02 | 7,81 |
| M. Nicolas DUPONT-AIGNAN | 4 | 4,82 | 6,25 |
| M. Benoît HAMON | 4 | 4,82 | 6,25 |
| M. Philippe POUTOU | 2 | 2,41 | 3,13 |
| Mme Nathalie ARTHAUD | 1 | 1,20 | 1,56 |
| M. Jacques CHEMINADE | 0 | 0,00 | 0,00 |
| M. François ASSELINEAU | 0 | 0,00 | 0,00 |
- Inscrits : 83
- Votants : 66 (soit 79,52 % de participation)
- Exprimés : 64
- Blancs et nuls : 2.
Sailly

| Liste des candidats | Voix | % Inscrits | % Exprimés |
|---|---|---|---|
| M. Emmanuel MACRON | 13 | 21,67 | 27,66 |
| Mme Marine LE PEN | 10 | 16,67 | 21,28 |
| M. Benoît HAMON | 7 | 11,67 | 14,89 |
| M. François FILLON | 6 | 10,00 | 12,77 |
| M. Nicolas DUPONT-AIGNAN | 5 | 8,33 | 10,64 |
| M. Jean-Luc MÉLENCHON | 5 | 8,33 | 10,64 |
| M. Jean LASSALLE | 1 | 1,67 | 2,13 |
| Mme Nathalie ARTHAUD | 0 | 0,00 | 0,00 |
| M. Philippe POUTOU | 0 | 0,00 | 0,00 |
| M. Jacques CHEMINADE | 0 | 0,00 | 0,00 |
| M. François ASSELINEAU | 0 | 0,00 | 0,00 |
- Inscrits : 60
- Votants : 48 (soit 80,00 % de participation)
- Exprimés : 47
- Blancs et nuls : 1.
Saint-André-le-Désert
| Liste des candidats | Voix | % Inscrits | % Exprimés |
|---|---|---|---|
| Mme Marine LE PEN | 43 | 20,19 | 24,86 |
| M. François FILLON | 43 | 20,19 | 24,86 |
| M. Emmanuel MACRON | 31 | 14,55 | 17,92 |
| M. Jean-Luc MÉLENCHON | 20 | 9,39 | 11,56 |
| M. Nicolas DUPONT-AIGNAN | 14 | 6,57 | 8,09 |
| M. Benoît HAMON | 10 | 4,69 | 5,78 |
| M. Jean LASSALLE | 5 | 2,35 | 2,89 |
| M. Philippe POUTOU | 4 | 1,88 | 2,31 |
| M. François ASSELINEAU | 3 | 1,41 | 1,73 |
| Mme Nathalie ARTHAUD | 0 | 0,00 | 0,00 |
| M. Jacques CHEMINADE | 0 | 0,00 | 0,00 |
- Inscrits : 213
- Votants : 176 (soit 82,63 % de participation)
- Exprimés : 173
- Blancs et nuls : 3.
Saint-Huruge

| Liste des candidats | Voix | % Inscrits | % Exprimés |
|---|---|---|---|
| M. François FILLON | 13 | 30,95 | 32,50 |
| M. Emmanuel MACRON | 7 | 16,67 | 17,50 |
| Mme Marine LE PEN | 5 | 11,90 | 12,50 |
| M. Jean-Luc MÉLENCHON | 5 | 11,90 | 12,50 |
| M. Nicolas DUPONT-AIGNAN | 4 | 9,52 | 10,00 |
| M. Jean LASSALLE | 3 | 7,14 | 7,50 |
| M. Benoît HAMON | 2 | 4,76 | 5,00 |
| M. François ASSELINEAU | 1 | 2,38 | 2,50 |
| Mme Nathalie ARTHAUD | 0 | 0,00 | 0,00 |
| M. Philippe POUTOU | 0 | 0,00 | 0,00 |
| M. Jacques CHEMINADE | 0 | 0,00 | 0,00 |
- Inscrits : 42
- Votants : 41 (soit 97,62 % de participation)
- Exprimés : 40
- Blancs et nuls : 1.
Saint-Clément-sur-Guye
| Liste des candidats | Voix | % Inscrits | % Exprimés |
|---|---|---|---|
| M. François FILLON | 28 | 22,05 | 25,23 |
| Mme Marine LE PEN | 24 | 18,90 | 21,62 |
| M. Jean-Luc MÉLENCHON | 23 | 18,11 | 20,72 |
| M. Benoît HAMON | 16 | 12,60 | 14,41 |
| M. Emmanuel MACRON | 10 | 7,87 | 9,01 |
| M. Nicolas DUPONT-AIGNAN | 7 | 5,51 | 6,31 |
| Mme Nathalie ARTHAUD | 2 | 1,57 | 1,80 |
| M. Jean LASSALLE | 1 | 0,79 | 0,90 |
| M. Philippe POUTOU | 0 | 0,00 | 0,00 |
| M. Jacques CHEMINADE | 0 | 0,00 | 0,00 |
| M. François ASSELINEAU | 0 | 0,00 | 0,00 |
- Inscrits : 127
- Votants : 112 (soit 88,19 % de participation)
- Exprimés : 111
- Blancs et nuls : 1.
Saint-Marcelin-de-Cray
| Liste des candidats | Voix | % Inscrits | % Exprimés |
|---|---|---|---|
| M. Jean-Luc MÉLENCHON | 36 | 22,50 | 27,69 |
| M. Emmanuel MACRON | 33 | 20,63 | 25,38 |
| M. François FILLON | 27 | 16,88 | 20,77 |
| Mme Marine LE PEN | 21 | 13,13 | 16,15 |
| M. Benoît HAMON | 7 | 4,38 | 5,38 |
| M. Nicolas DUPONT-AIGNAN | 5 | 3,13 | 3,85 |
| M. Philippe POUTOU | 1 | 0,63 | 0,77 |
| Mme Nathalie ARTHAUD | 0 | 0,00 | 0,00 |
| M. Jacques CHEMINADE | 0 | 0,00 | 0,00 |
| M. Jean LASSALLE | 0 | 0,00 | 0,00 |
| M. François ASSELINEAU | 0 | 0,00 | 0,00 |
- Inscrits : 160
- Votants : 138 (soit 86,25 % de participation)
- Exprimés : 130
- Blancs et nuls : 8.
Saint-Martin-de-Salencey
| Liste des candidats | Voix | % Inscrits | % Exprimés |
|---|---|---|---|
| M. François FILLON | 20 | 21,28 | 27,40 |
| M. Jean-Luc MÉLENCHON | 16 | 17,02 | 21,92 |
| M. Emmanuel MACRON | 12 | 12,77 | 16,44 |
| M. Benoît HAMON | 11 | 11,70 | 15,07 |
| Mme Marine LE PEN | 8 | 8,51 | 10,96 |
| M. Nicolas DUPONT-AIGNAN | 5 | 5,32 | 6,85 |
| M. Jean LASSALLE | 1 | 1,06 | 1,37 |
| Mme Nathalie ARTHAUD | 0 | 0,00 | 0,00 |
| M. Philippe POUTOU | 0 | 0,00 | 0,00 |
| M. Jacques CHEMINADE | 0 | 0,00 | 0,00 |
| M. François ASSELINEAU | 0 | 0,00 | 0,00 |
- Inscrits : 94
- Votants : 74 (soit 78,72 % de participation)
- Exprimés : 73
- Blancs et nuls : 1.
Saint-Martin-la-Patrouille

| Liste des candidats | Voix | % Inscrits | % Exprimés |
|---|---|---|---|
| Mme Marine LE PEN | 12 | 18,18 | 24,49 |
| M. Emmanuel MACRON | 11 | 16,67 | 22,45 |
| M. Jean-Luc MÉLENCHON | 9 | 13,64 | 18,37 |
| M. François ASSELINEAU | 7 | 10,61 | 14,29 |
| M. François FILLON | 5 | 7,58 | 10,20 |
| M. Nicolas DUPONT-AIGNAN | 2 | 3,03 | 4,08 |
| M. Benoît HAMON | 2 | 3,03 | 4,08 |
| Mme Nathalie ARTHAUD | 1 | 1,52 | 2,04 |
| M. Philippe POUTOU | 0 | 0,00 | 0,00 |
| M. Jacques CHEMINADE | 0 | 0,00 | 0,00 |
| M. Jean LASSALLE | 0 | 0,00 | 0,00 |
- Inscrits : 66
- Votants : 50 (soit 75,76 % de participation)
- Exprimés : 49
- Blancs et nuls : 1.
Saint-Vincent-des-Prés

| Liste des candidats | Voix | % Inscrits | % Exprimés |
|---|---|---|---|
| M. Emmanuel MACRON | 18 | 18,18 | 22,78 |
| M. Jean-Luc MÉLENCHON | 17 | 17,17 | 21,52 |
| M. François FILLON | 14 | 14,14 | 17,72 |
| M. Benoît HAMON | 13 | 13,13 | 16,46 |
| Mme Marine LE PEN | 8 | 8,08 | 10,13 |
| M. Nicolas DUPONT-AIGNAN | 6 | 6,06 | 7,59 |
| M. François ASSELINEAU | 2 | 2,02 | 2,53 |
| M. Philippe POUTOU | 1 | 1,01 | 1,27 |
| Mme Nathalie ARTHAUD | 0 | 0,00 | 0,00 |
| M. Jacques CHEMINADE | 0 | 0,00 | 0,00 |
| M. Jean LASSALLE | 0 | 0,00 | 0,00 |
- Inscrits : 99
- Votants : 84 (soit 84,85 % de participation)
- Exprimés : 79
- Blancs et nuls : 5.
Saint-Ythaire
| Liste des candidats | Voix | % Inscrits | % Exprimés |
|---|---|---|---|
| Mme Marine LE PEN | 21 | 18,42 | 20,79 |
| M. Emmanuel MACRON | 20 | 17,54 | 19,80 |
| M. Jean-Luc MÉLENCHON | 18 | 15,79 | 17,82 |
| M. François FILLON | 14 | 12,28 | 13,86 |
| M. Benoît HAMON | 13 | 11,40 | 12,87 |
| M. François ASSELINEAU | 7 | 6,14 | 6,93 |
| M. Nicolas DUPONT-AIGNAN | 5 | 4,39 | 4,95 |
| M. Jean LASSALLE | 2 | 1,75 | 1,98 |
| M. Jacques CHEMINADE | 1 | 0,88 | 0,99 |
| Mme Nathalie ARTHAUD | 0 | 0,00 | 0,00 |
| M. Philippe POUTOU | 0 | 0,00 | 0,00 |
- Inscrits : 114
- Votants : 102 (soit 89,47 % de participation)
- Exprimés : 101
- Blancs et nuls : 1.
Sainte-Cécile
| Liste des candidats | Voix | % Inscrits | % Exprimés |
|---|---|---|---|
| Mme Marine LE PEN | 43 | 20,67 | 26,38 |
| M. Emmanuel MACRON | 39 | 18,75 | 23,93 |
| M. François FILLON | 32 | 15,38 | 19,63 |
| M. Jean-Luc MÉLENCHON | 17 | 8,17 | 10,43 |
| M. Benoît HAMON | 12 | 5,77 | 7,36 |
| M. Nicolas DUPONT-AIGNAN | 11 | 5,29 | 6,75 |
| M. Philippe POUTOU | 4 | 1,92 | 2,45 |
| M. Jean LASSALLE | 3 | 1,44 | 1,84 |
| M. Jacques CHEMINADE | 1 | 0,48 | 0,61 |
| M. François ASSELINEAU | 1 | 0,48 | 0,61 |
| Mme Nathalie ARTHAUD | 0 | 0,00 | 0,00 |
- Inscrits : 208
- Votants : 175 (soit 84,13 % de participation)
- Exprimés : 163
- Blancs et nuls : 12.
Salornay-sur-Guye

| Liste des candidats | Voix | % Inscrits | % Exprimés |
|---|---|---|---|
| Mme Marine LE PEN | 116 | 19,56 | 24,17 |
| M. François FILLON | 101 | 17,03 | 21,04 |
| M. Jean-Luc MÉLENCHON | 89 | 15,01 | 18,54 |
| M. Emmanuel MACRON | 83 | 14,00 | 17,29 |
| M. Benoît HAMON | 48 | 8,09 | 10,00 |
| M. Nicolas DUPONT-AIGNAN | 24 | 4,05 | 5,00 |
| M. Jean LASSALLE | 7 | 1,18 | 1,46 |
| Mme Nathalie ARTHAUD | 6 | 1,01 | 1,25 |
| M. François ASSELINEAU | 4 | 0,67 | 0,83 |
| M. Philippe POUTOU | 2 | 0,34 | 0,42 |
| M. Jacques CHEMINADE | 0 | 0,00 | 0,00 |
- Inscrits : 593
- Votants : 495 (soit 83,47 % de participation)
- Exprimés : 480
- Blancs et nuls : 15.
Sigy-le-Châtel

| Liste des candidats | Voix | % Inscrits | % Exprimés |
|---|---|---|---|
| M. Emmanuel MACRON | 25 | 28,09 | 32,89 |
| Mme Marine LE PEN | 14 | 15,73 | 18,42 |
| M. François FILLON | 13 | 14,61 | 17,11 |
| M. Jean-Luc MÉLENCHON | 8 | 8,99 | 10,53 |
| M. Nicolas DUPONT-AIGNAN | 7 | 7,87 | 9,21 |
| M. Benoît HAMON | 4 | 4,49 | 5,26 |
| M. Jean LASSALLE | 4 | 4,49 | 5,26 |
| M. François ASSELINEAU | 1 | 1,12 | 1,32 |
| Mme Nathalie ARTHAUD | 0 | 0,00 | 0,00 |
| M. Philippe POUTOU | 0 | 0,00 | 0,00 |
| M. Jacques CHEMINADE | 0 | 0,00 | 0,00 |
- Inscrits : 89
- Votants : 78 (soit 87,64 % de participation)
- Exprimés : 76
- Blancs et nuls : 2.
Sivignon
| Liste des candidats | Voix | % Inscrits | % Exprimés |
|---|---|---|---|
| M. Emmanuel MACRON | 41 | 27,89 | 32,54 |
| M. Jean-Luc MÉLENCHON | 34 | 23,13 | 26,98 |
| M. François FILLON | 25 | 17,01 | 19,84 |
| Mme Marine LE PEN | 11 | 7,48 | 8,73 |
| M. Benoît HAMON | 9 | 6,12 | 7,14 |
| M. Nicolas DUPONT-AIGNAN | 4 | 2,72 | 3,17 |
| Mme Nathalie ARTHAUD | 1 | 0,68 | 0,79 |
| M. Jean LASSALLE | 1 | 0,68 | 0,79 |
| M. Philippe POUTOU | 0 | 0,00 | 0,00 |
| M. Jacques CHEMINADE | 0 | 0,00 | 0,00 |
| M. François ASSELINEAU | 0 | 0,00 | 0,00 |
- Inscrits : 147
- Votants : 127 (soit 86,39 % de participation)
- Exprimés : 126
- Blancs et nuls : 1.
Taizé

| Liste des candidats | Voix | % Inscrits | % Exprimés |
|---|---|---|---|
| M. Emmanuel MACRON | 36 | 47,37 | 57,14 |
| M. Benoît HAMON | 8 | 10,53 | 12,70 |
| M. Jean-Luc MÉLENCHON | 6 | 7,89 | 9,52 |
| Mme Marine LE PEN | 5 | 6,58 | 7,94 |
| M. François FILLON | 5 | 6,58 | 7,94 |
| M. Jean LASSALLE | 2 | 2,63 | 3,17 |
| M. Philippe POUTOU | 1 | 1,32 | 1,59 |
| M. Nicolas DUPONT-AIGNAN | 0 | 0,00 | 0,00 |
| Mme Nathalie ARTHAUD | 0 | 0,00 | 0,00 |
| M. Jacques CHEMINADE | 0 | 0,00 | 0,00 |
| M. François ASSELINEAU | 0 | 0,00 | 0,00 |
- Inscrits : 76
- Votants : 63 (soit 82,39 % de participation)
- Exprimés : 63
- Blancs et nuls : 0.
Retrouvez l’ensemble des résultats du département sur le site internet du ministère de l’Intérieur.